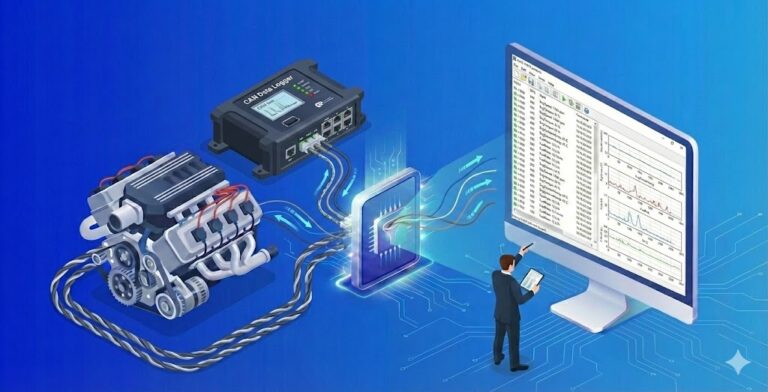
CAN data requires frame decoding (signal conversion) and the plotting of large time series, making it necessary to analyze it using dedicated tools such as CANalyzer. However, dedicated tools like CANalyzer are expensive and can be difficult to operate when reviewing data. With Echart, you can quickly visualize signal changes over time by simply specifying and importing the CAN log and DBC. In this article, we will explain the steps from loading ASC+DBC data to graph display in terms of on-screen operations.